
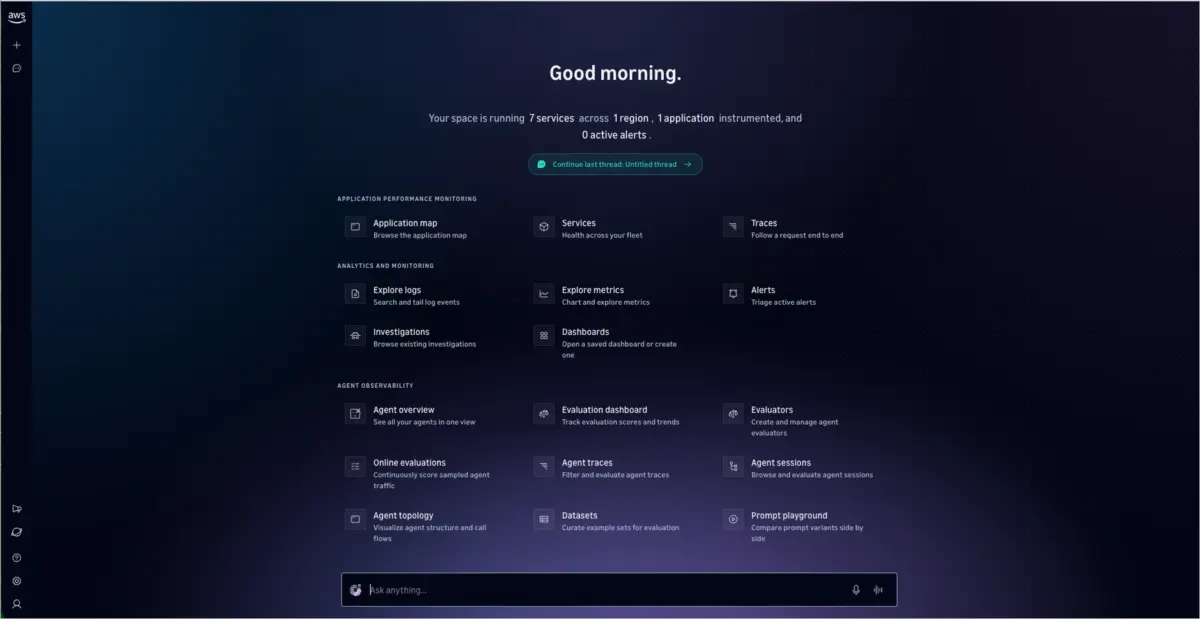
Today, Amazon Web Services has introduced Amazon CloudWatch Omni, a unified observability solution designed specifically for modern application and generative AI workloads. Built on open standards and delivered off-console, CloudWatch Omni offers an app-centric, AI-powered platform for development and operations teams. The solution is engineered to help engineers design, evaluate, and operate autonomous AI agents seamlessly across any model provider, framework, or runtime environment, providing an evaluation-driven workflow that integrates directly into existing developer tools and standalone web interfaces.
Organizations deploying agentic artificial intelligence systems have increasingly faced observability hurdles that conventional monitoring frameworks simply cannot resolve. Unlike deterministic software applications, AI agents exhibit non-deterministic behavior, meaning a minor alteration to a prompt can degrade response quality even when standard performance metrics register zero errors. Engineering teams frequently spend hours manually sifting through logs distributed across multiple disparate systems, struggling to pinpoint precisely what changed or why an unexpected outcome occurred. Existing market solutions have historically forced developers into a difficult compromise: choosing between siloed generative AI monitoring tools or fragmented ecosystems that demand constant context-switching between localized coding environments and browser-based dashboards.
CloudWatch Omni addresses these friction points by capturing every operational trace and embedding native evaluators for metrics such as response correctness, semantic coherence, retrieval quality, and tool selection accuracy. Developers and operators can compare prompt iterations side by side within an interactive playground, automatically construct test datasets from live production traffic, execute batch experiments across varied configurations, and proactively detect quality regressions before they impact end users.

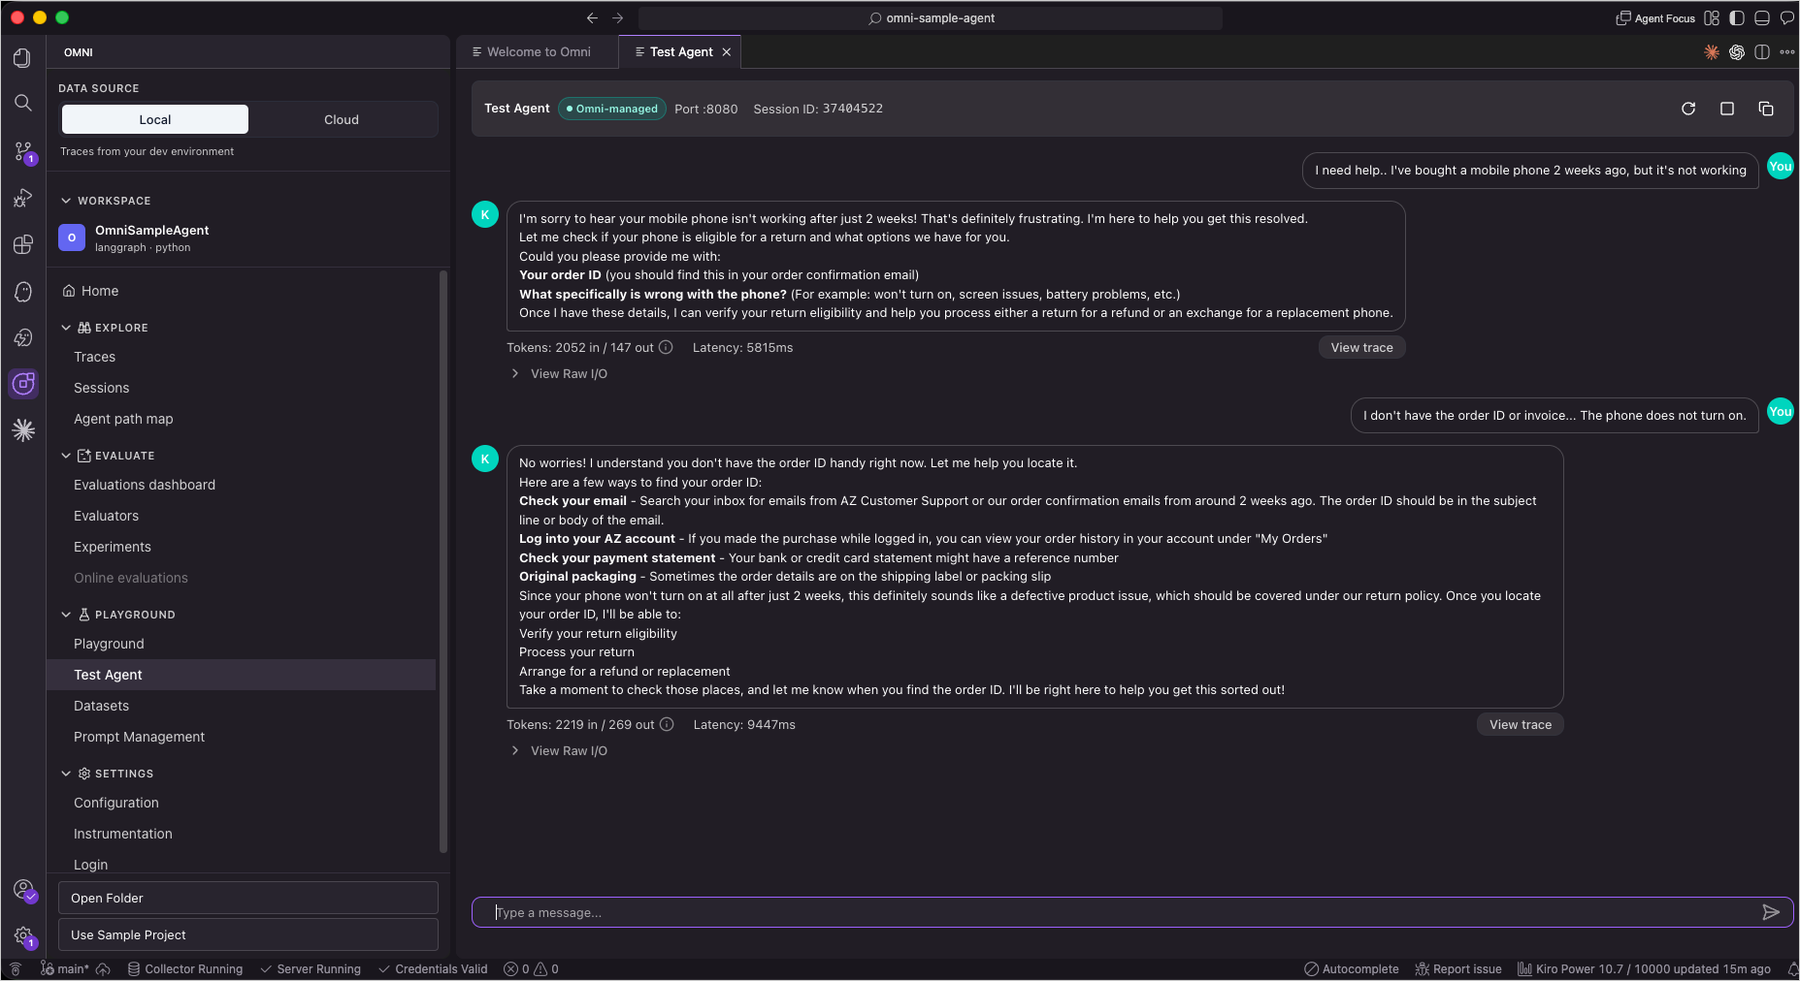
The platform delivers its comprehensive observability feature set through two distinct yet deeply interconnected surfaces. Developers gain access to a native extension built directly for integrated development environments like Visual Studio Code and Kiro, where telemetry traces materialize in real time as agents execute, placing debugging tools, playgrounds, and evaluators just a single click away. Meanwhile, operations personnel are provided with a standalone web experience that operates entirely separate from the traditional AWS Management Console. This web interface allows technical teams to monitor fleet-wide agent deployments securely via Single Sign-On without ever requiring direct access to the AWS console. Crucially, both surfaces draw from the exact same underlying telemetry data, ensuring that the precise trace a developer investigates locally is the identical trace an operator analyzes in production.
To bridge the local development lifecycle with cloud-scale operations, CloudWatch Omni features a Cloud Login capability. This function connects a local IDE environment directly to an authorized AWS account, enabling engineers to securely transmit telemetry data to Amazon CloudWatch for persistent long-term storage, share detailed traces seamlessly across collaborative teams, and tap into centralized production dashboards. However, this cloud connection remains entirely optional. Development teams retain the flexibility to utilize CloudWatch Omni locally throughout the entire coding and testing phase, establishing a seamless migration path to cloud-based monitoring only when their agents are ready for production release.
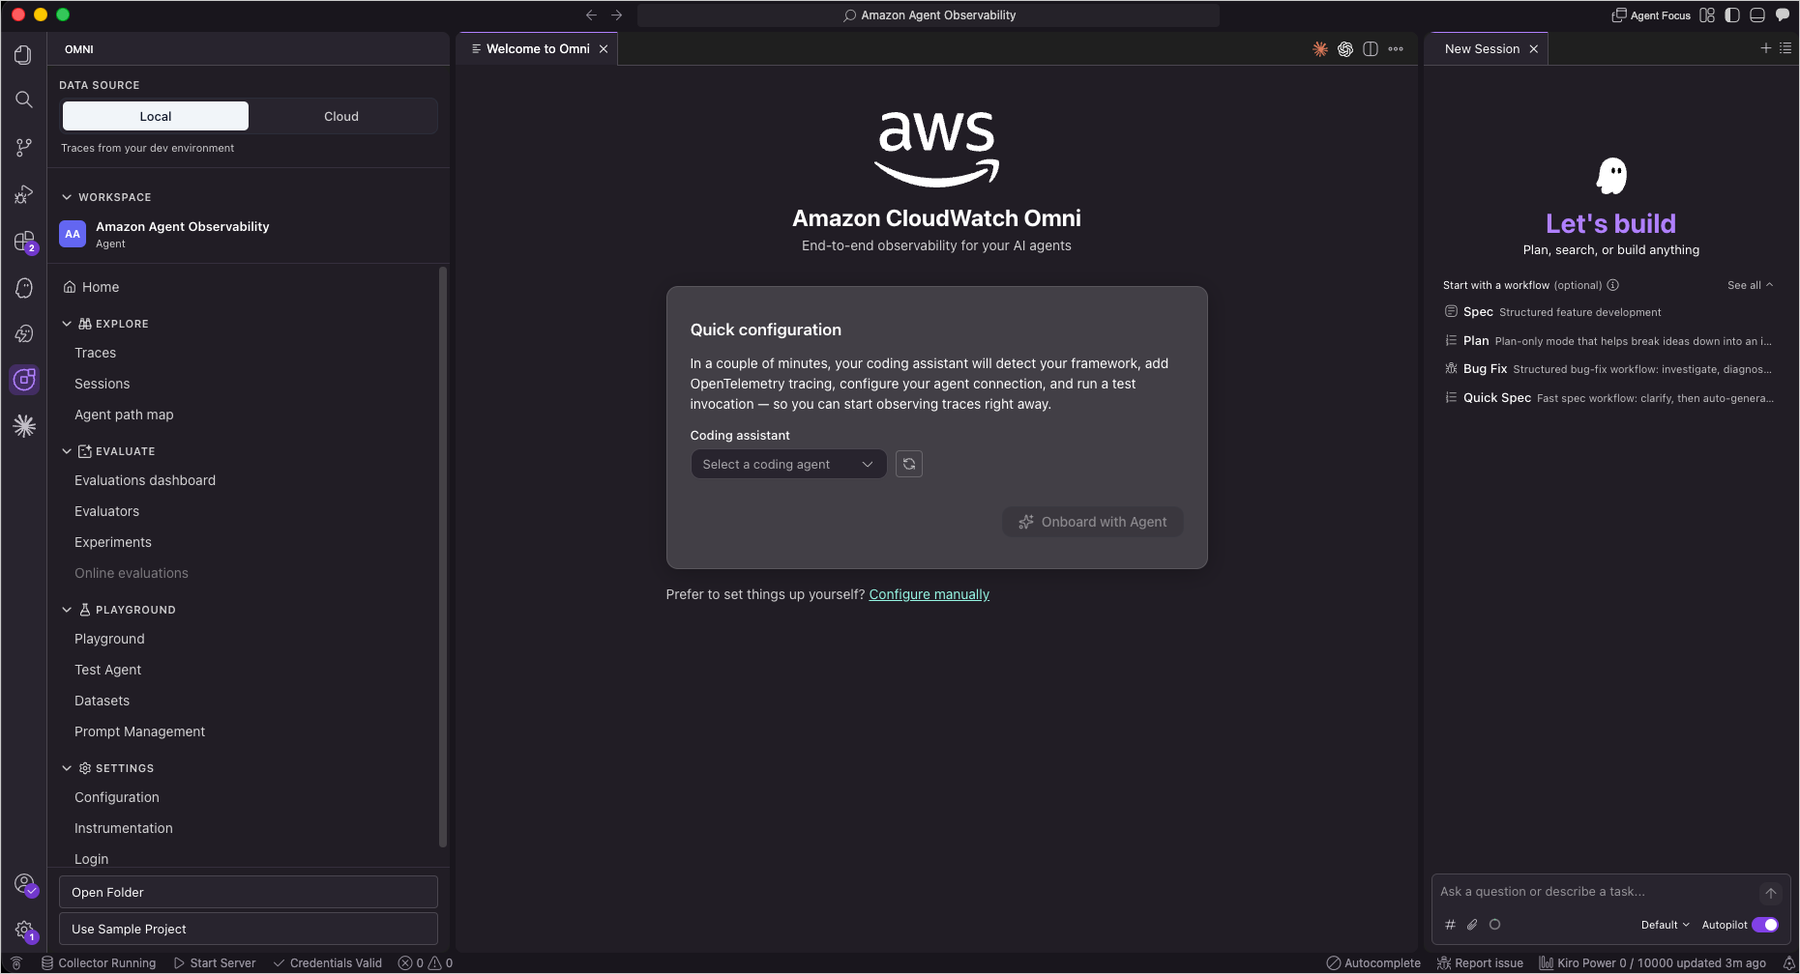
Getting started with CloudWatch Omni is designed to accommodate various developer workflows, offering access through either the IDE extension or directly via the cloud-based web experience where teams can begin ingesting telemetry data without installing any local software extensions. Upon adding the extension from the VS Code Marketplace, a dedicated icon appears within the Activity Bar, providing immediate access to pre-configured sample projects containing live agent implementations and sample trace data. Alternatively, engineers can construct new agent architectures from scratch using an interactive conversational interface that assists in defining agent objectives, selecting preferred model providers, and configuring necessary tools while storing all operational data locally by default.
CloudWatch Omni integrates fluidly with advanced AI code assistants—including Kiro, Claude Code, and Codex—to automate environment provisioning. These assistants can independently configure local development servers, install required dependencies, and set up OpenTelemetry instrumentation on behalf of the developer, drastically reducing the time required to transition from initial installation to executing a fully traced agent session.
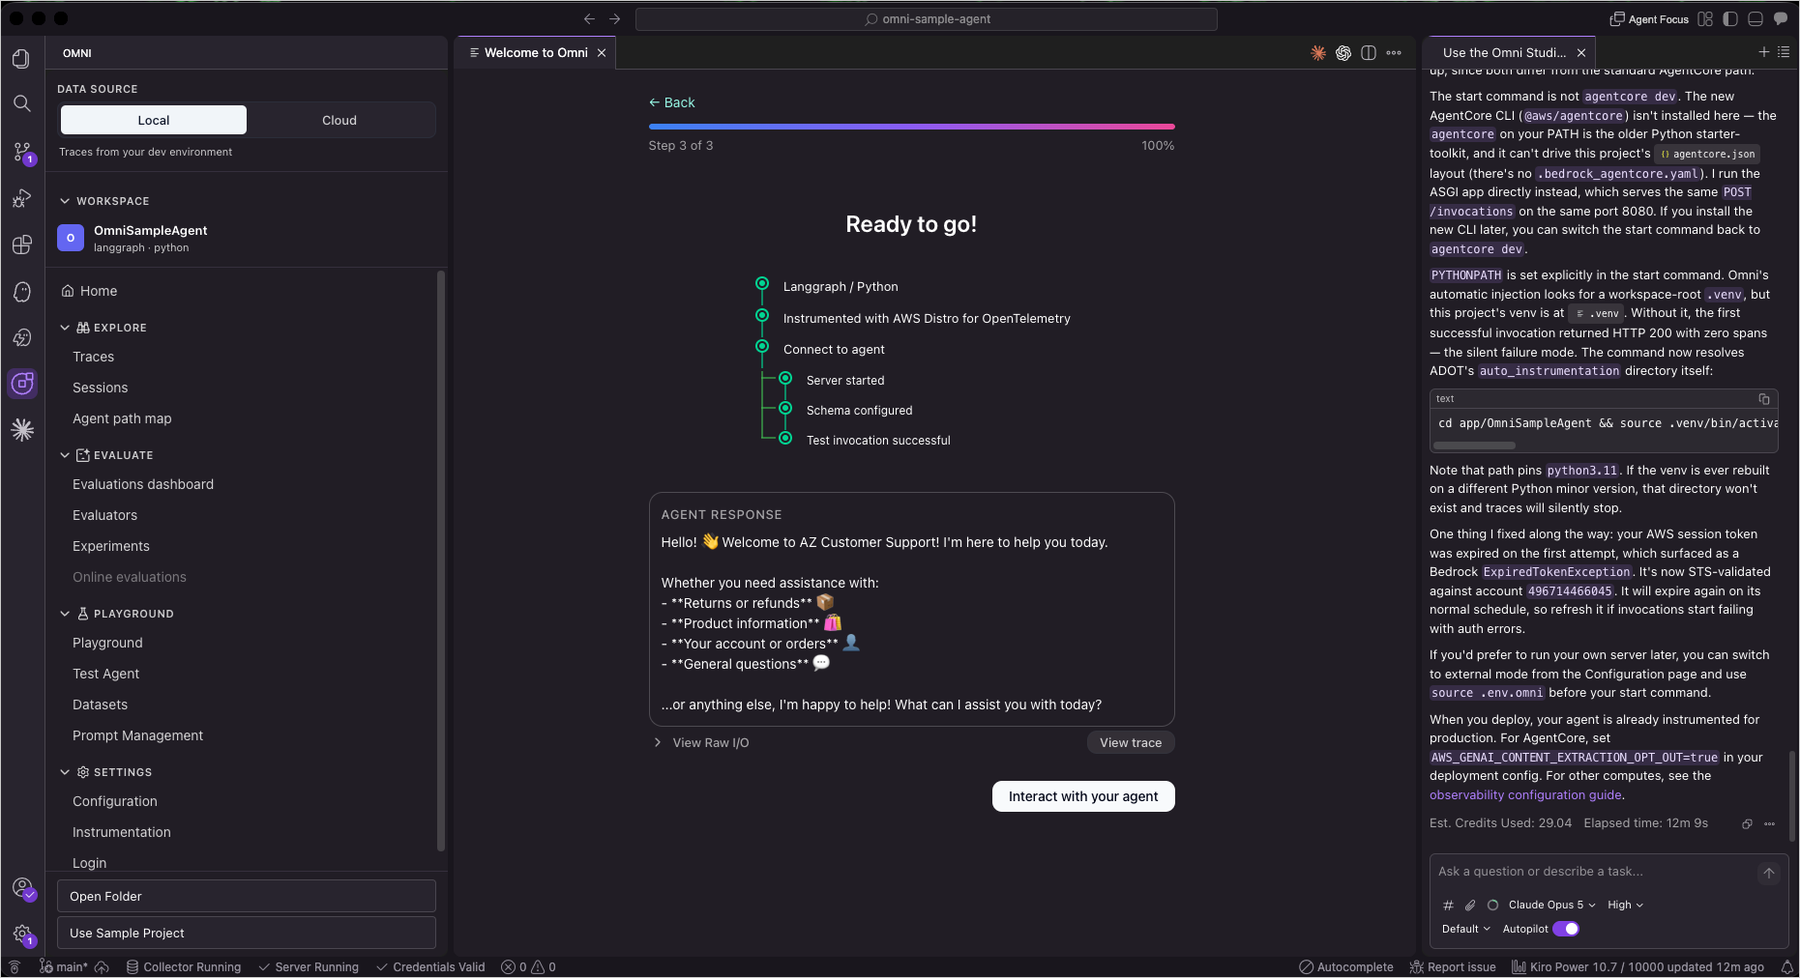
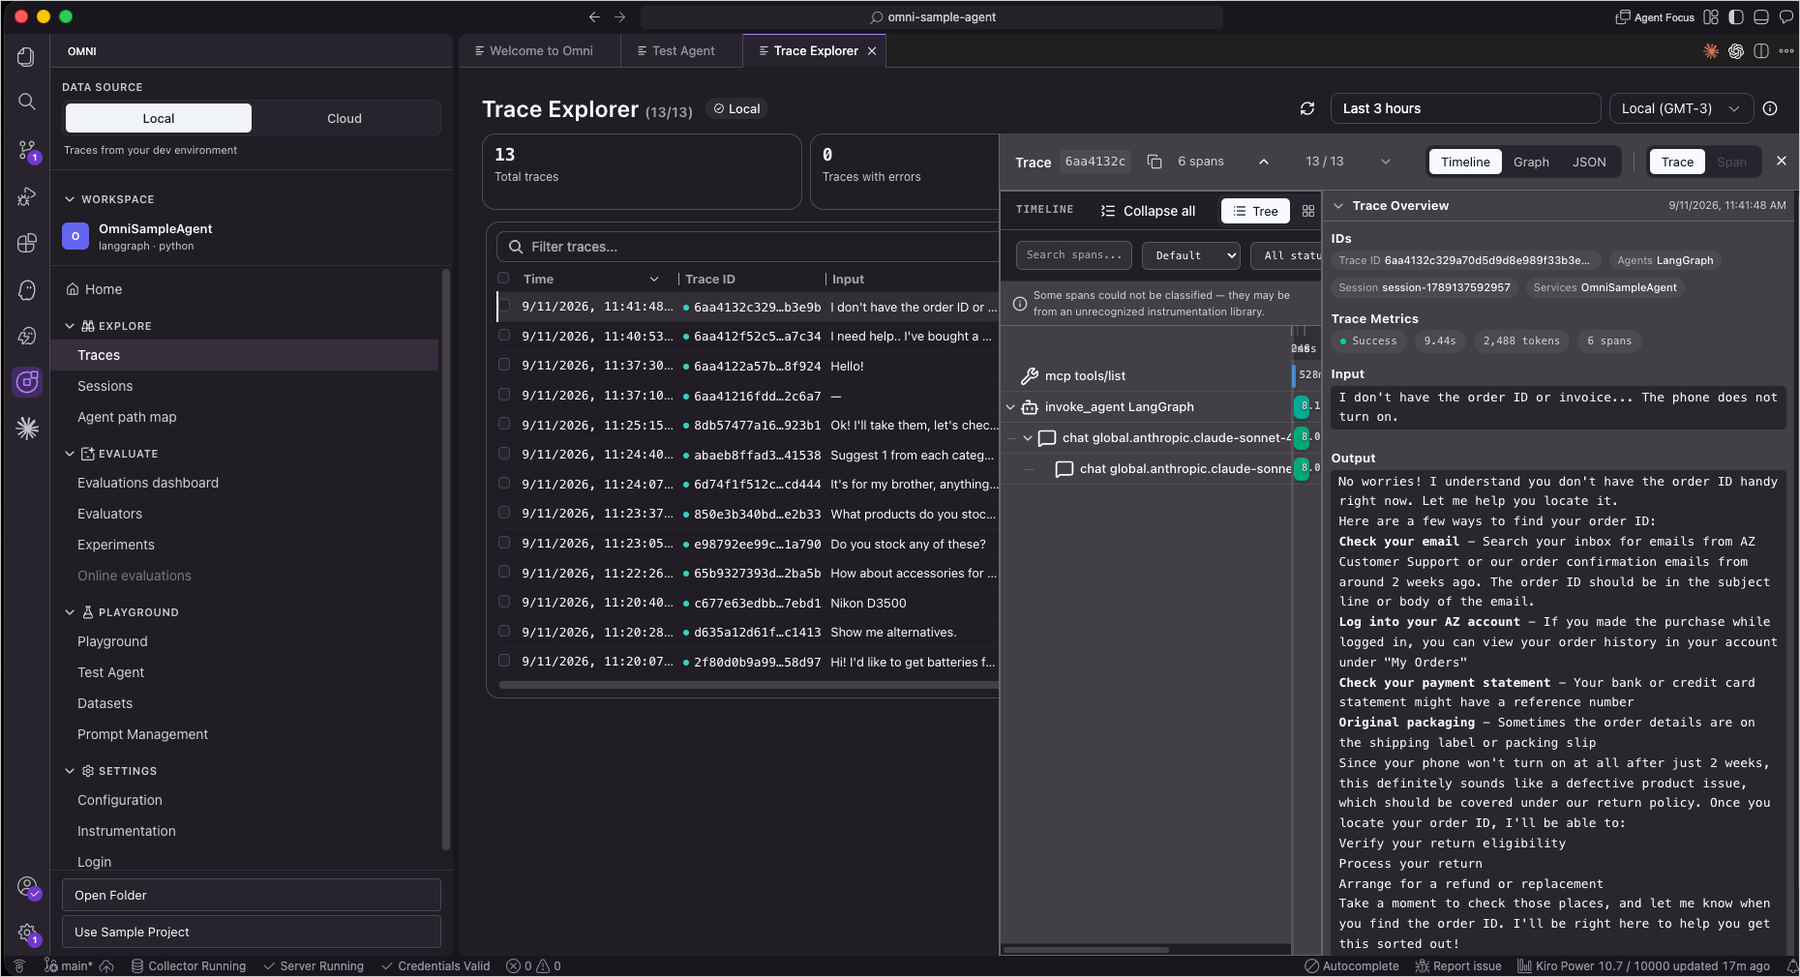
Because AI agents make numerous independent decisions during a single user invocation—such as dynamically selecting specialized tools, composing complex prompts, and chaining secondary sub-calls—complete trace visibility is paramount. Without structured monitoring, diagnosing why an intelligent agent returned an erroneous conclusion or pursued an unexpected execution path remains a matter of guesswork. CloudWatch Omni records every granular step within a structured timeline, enabling engineers to isolate the exact moment behavior diverged.
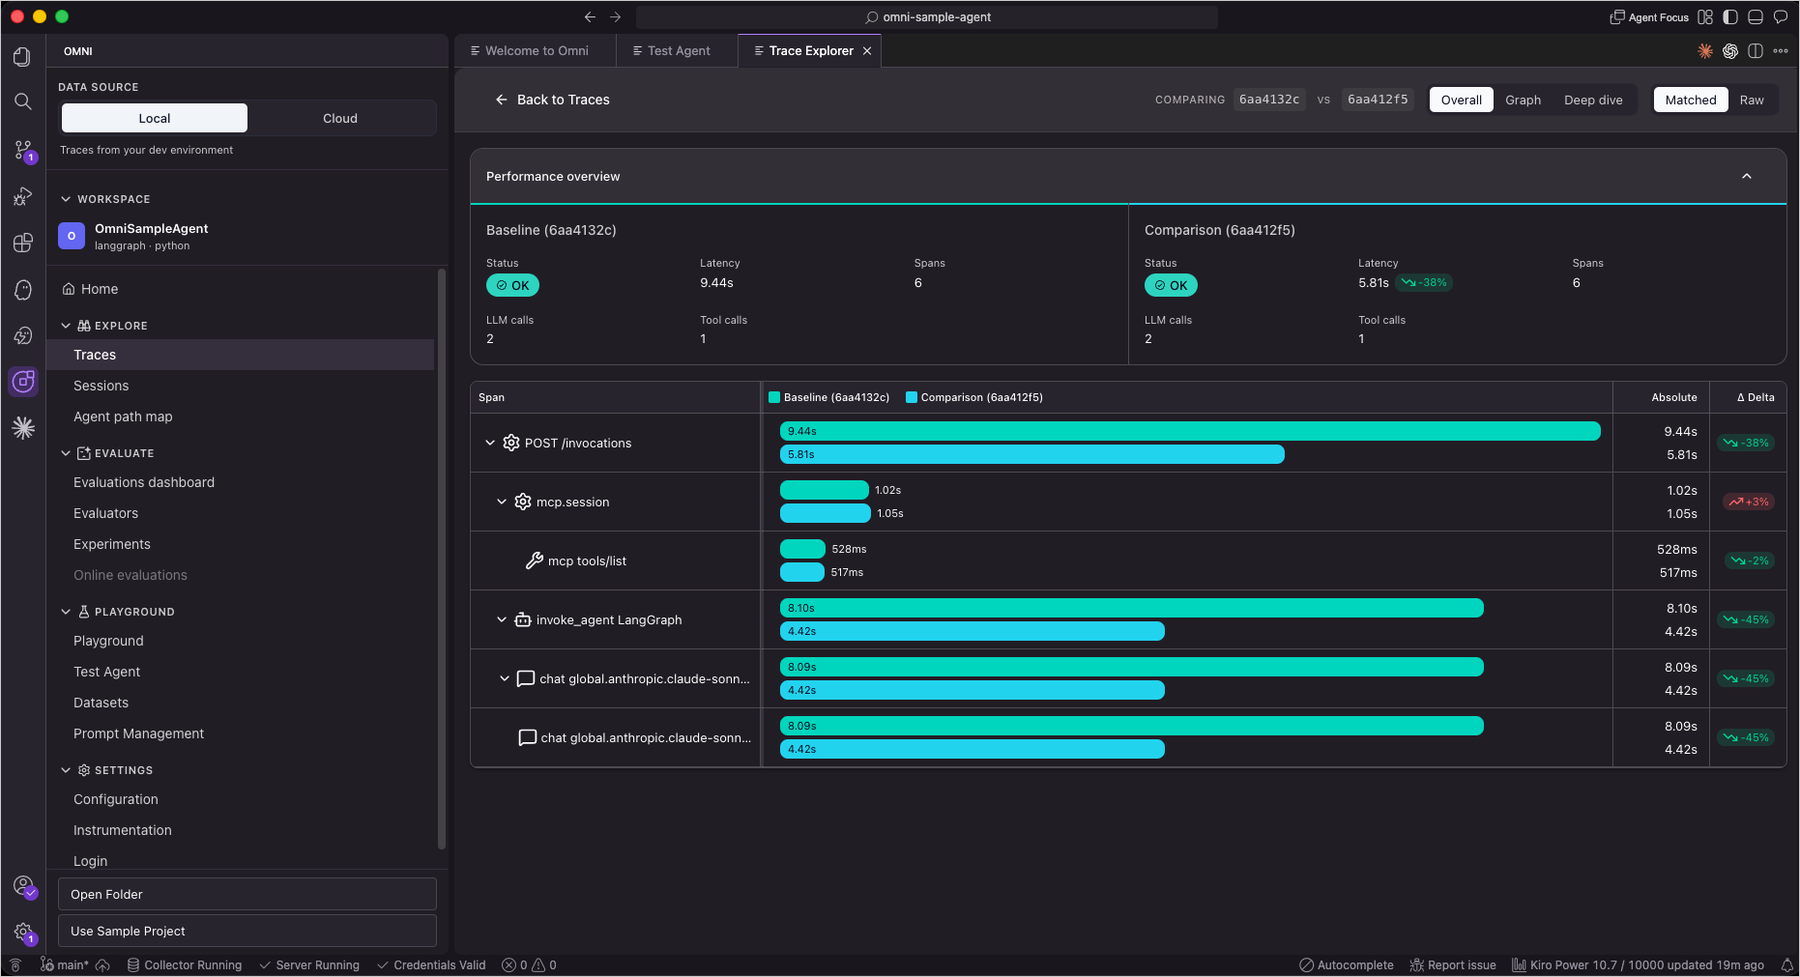
The built-in Trace Explorer provides a hierarchical breakdown of every phase of agent execution, encompassing large language model calls, tool interactions, and internal reasoning steps. Engineers can drill down into individual spans to inspect raw inputs, generated outputs, token consumption metrics, and execution latency. Furthermore, the Trace Explorer features a dedicated Compare mode, which positions two distinct traces side by side to evaluate how modifications in system prompts or underlying configurations alter agent behavior, proving especially valuable during regression debugging. An integrated Ask Assistant capability also allows teams to query their trace data using natural language, receiving automated insights into anomalous behaviors or unexpected execution loops.
Moving beyond basic performance metrics, CloudWatch Omni incorporates robust evaluation capabilities that translate raw observability data into actionable quality improvements. Traditional monitoring metrics like latency and error rates fail to capture whether an agent’s response was genuinely helpful, logically coherent, or factually accurate. The platform includes seventeen built-in evaluators designed to score individual responses against specific quality dimensions, allowing teams to measure real-world user experiences and catch subtle regressions that standard system monitoring overlooks.
Engineers can select specific traces from the Trace Explorer, apply chosen evaluators, and instantly generate granular per-example scores alongside high-level aggregate metrics without needing to construct bespoke evaluation frameworks. Within the interactive Playground, teams can test competing system prompts side by side, evaluating multiple model and prompt configurations in real time to assess output quality prior to deployment. The integrated Experiments view further allows developers to pit different agent variants against standardized test datasets, comparing evaluation scores, latency profiles, and token usage side by side to identify optimal configurations.
Additional tools like Prompt Management allow developers to version and track prompt configurations over time, facilitating seamless rollbacks when newer iterations underperform. A Session Explorer provides deep visibility into multi-turn conversation histories, while an Agent Topology view visually maps the architecture of complex agent systems, detailing sub-agents, tools, and their interconnections so teams can easily inspect performance bottlenecks. The separate web experience extends these collaborative monitoring, analytics, and AI-powered investigation capabilities to stakeholders across the organization via any standard web browser.
CloudWatch Omni supports the open-source frameworks and standards that engineering teams already rely upon, including LangChain, LangGraph, CrewAI, the OpenAI SDK, Strands, and the Vercel AI SDK across both Python and TypeScript. Furthermore, the platform provides native observability for agents developed using Amazon Bedrock AgentCore, leveraging its native evaluation features directly within the Omni workflow. By utilizing open standards such as OpenInference and AWS Distro for OpenTelemetry, the solution operates across diverse hosting environments—whether agents are deployed on AWS Lambda, Amazon ECS, Amazon EKS, or alternative cloud infrastructures—without requiring architectural re-platforming.
Amazon CloudWatch Omni is generally available today. The IDE extension is offered free of charge and does not require an active AWS account for local development, with credentials necessary only when integrating with Amazon Bedrock or third-party model providers like OpenAI and Anthropic. Developers can download the extension directly from the Visual Studio Code Marketplace and explore full documentation through the AWS Builder Center and Amazon CloudWatch resources.